發信人mariusz.gromada@gmail.com (Mariusz Gromada),
看板FB_security
標 題Re: Collecting entropy from device_attach() times.
發信站NCTU CS FreeBSD Server (Thu Sep 20 08:57:43 2012)
轉信站ptt!csnews.cs.nctu!news.cs.nctu!.cs.nctucs.nctu!.org!ownorg!owner-free
> On Wed, Sep 19, 2012 at 09:29:23PM +0200, Pawel Jakub Dawidek wrote:
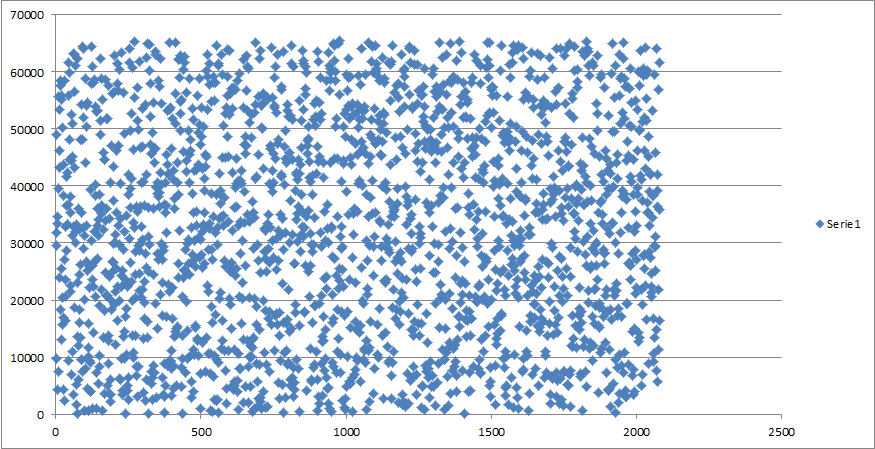
> Here's how the distribution looks like for device_attach() times of my
> sound card. The times were 26bit numbers, so this is after discarding
> top ten bits, which leave us with 16 lower bits of pure entropy:)
> http://people.freebsd.org/~pjd/misc/harvest_device_attach.png Kudos to
> my friend Mariusz (CCed) who is mathematician and who helped me with
> visualization and also promissed to prepare formal proof:)
Hi All,
I am not a mathematician :-) Below you will find some initial formal proof.
Problem definition: checking if data sample comes from uniform distribution.
Data sample: 2081 empirical observations (after discarding top ten bits)
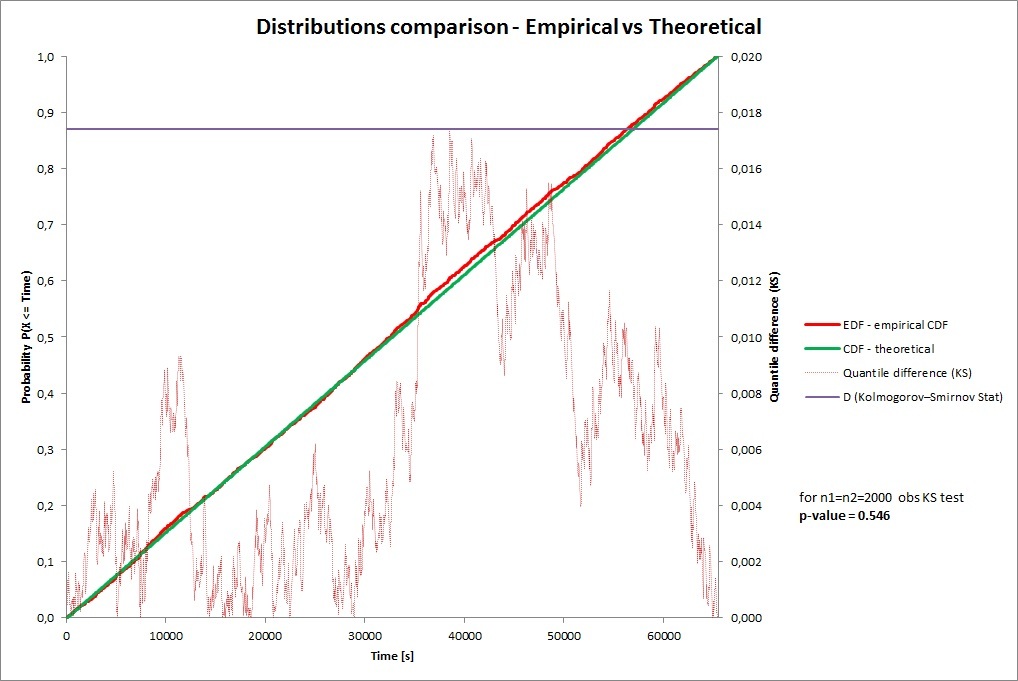
One-sample Kolmogorv-Smirnov test
Hypothesis (based on the Cumulative Distribution Functions)
H0: Empirical CDF given by 2081 obs. = theoretical uniform CDF
H1: (alternatively) Empirical CDF is different than theoretical uniform CDF
K-S Statistic: D = 0.017405527
p-value = 0.535
Interpretation: if p-value is much higher than significance level
(alpha) then there is no reason to reject H0 hypothesis, if p-value is
much smaller than significance level (alpha) then we strongly reject H0
hypothesis.
So take any reasonable significance level (i.e. alpha = 0.05 which is
far less than 0.535) and you have a proof that empirical observations
are in fact given by random uniform numbers.
Additionally please take a look on the linked chart
http://bamper.vot.pl/ks.jpg
It shows:
Good fit in general
Best fit for the range 0 - c.a 3000
Worse fit for the range c.a. 3000 - 65536
It means that numbers between 0 - 3000 are more random than numbers
between 3000 - 6536
Best regards,
Mariusz
_______________________________________________
freebsd-security@freebsd.org mailing list
http://lists.freebsd.org/mailman/listinfo/freebsd-security
To unsubscribe, send any mail to "freebsd-security-unsubscribe@freebsd.org"